Friday, December 30, 2011

Drug war opportunity costs

From New Hampshire Magazine:
Reducing that access [to marijuana] was John Tommasi's life in the 1980s. An undercover cop in Salem, N.H., he was assigned in 1987 to the New Hampshire Drug Task Force, a state agency funded by the federal War on Drugs. He says the action was fast and furious: "As soon as you arrest one person, there's another five to 10 to take that person's place."
Tommasi was also a pilot and that became his undercover persona: "You're doing great felony work and you're not stuck on the barking dog calls. But at some point I realized I was not having any effect whatsoever. This is having no effect at all. So is this really the right way to go? So I started doing some research."
Tommasi's research was part of earning a Masters Degree in Economics to go with his MBA. His principal conclusion: "We have in economics what is known as opportunity cost. So if I'm working on violations with drugs then I'm not working on, say, burglaries or other crimes. And if you're out there on the drug war, you must be taking the dealers off the streets, right? That's not the case."
Instead, the purity and potency of the drugs had increased while the price had gone down. Tommasi published a report on how much money would be saved if marijuana were legalized. The report drew much public attention and criticism from law enforcement agencies.
Tommasi began teaching courses on the Drug War and is now a full-time professor at Bentley College in Massachusetts. But he's also still a cop: "I do Hampton in the summer and I've arrested people for marijuana because I took an oath to uphold the state laws and my integrity transcends my own personal views." Then Tommasi, the economist, has to add: "But if I make a marijuana arrest, I'm tied up for a couple of hours at the station booking and I'm not keeping peace on the streets of Hampton - and in the summer, it gets busy."
And more:
Opponents of decriminalization often point to the fact that charges of simple possession rarely lead to any jail time. Still, the number of marijuana arrests has been rising steadily. In 1995 arrests for marijuana possession were a third of all drug arrests. Now they are nearly half and that, says Ed Kelly [administrative justice of New Hampshire's circuit courts], creates a big problem. "If we have a courtroom filled with cases like the ones we're talking about - first offenders who are never coming back again and don't have a drug abuse problem - and it takes us all day to deal with those cases, that's a day that we don't have to deal with, say, a very difficult divorce case involving children. So we've got a family in crisis waiting to get into court and us trying to find a day to get that family into court to deal with their issues so they can get on with their lives. And we're dealing with these cases over in the other court room that are going to result in a $500 fine and cost the state lots of money to prosecute. All for what I think is a pretty unclear objective."
It's a fantastic article. Definitely worth reading.

Sunday, September 4, 2011

W-NOMINATE page finished

I've finally organized all of the W-NOMINATE data, creating better looking graphs and outsourcing much of the data to Google Docs.

Tuesday, August 23, 2011

New Hampshire has the highest well-being in New England

So reports a new release from Gallup.

(Hat tip to Scott Moody at the Maine Freedom Forum.)

Scott suggests that this is related to New Hampshire's low unemployment rate. This sounds plausible to me.

New Hampshire's relatively wealthy populace probably pushed the score higher as well.

Posting will be light for a bit

For two reasons-

1) School season is starting. (Yes, I am a student. Have pity on me.)

2) My computer is working better than it has in about 4 years, and I'm exploring a wide variety of helpful, open-source software packages (such as R and the W-NOMINATE add-on). With any luck, I will find some interesting data along the way, which I will dutifully post here.

Saturday, July 30, 2011

Fallacy of composition, W-NOMINATE version

I've been neglecting my blog lately. Much of the reason is that I've been working to understand the political science program NOMINATE, so that I can gather information about the ideological make-up of the New Hampshire legislature.

The data is posted on the W-NOMINATE page of my blog. Here's the cool graph (click to enlarge):

Keith Poole and Howard Rosenthal, the main developers of the program, claim that the program measures economic attitudes on the x-axis, and, in recent years, social attitudes on the y-axis.

At first blush this is what it appeared to be doing for New Hampshire legislators. However, after taking a closer look at the votes, I discovered that it's not doing this. At least, not very well.

The x-axis measures economic issues well, and correlates beautifully with the House Republican Alliance's scorecard ratings. (See this impressive graph, courtesy of Seth Cohn.) The y-axis, on the other hand, has issues. Apparently, because there have been so few votes on social issues this year, there is little basis for the y-values. Mostly they reflect positions on gun rights and criminal justice issues, with pro-gun and tough on crime on the bottom.

This is yet another reminder that politics at the state level does not necessarily imitate politics at the federal level.

Thanks to Rep. Seth Cohn, Scott Pauls at Dartmouth, and professor Jason Sorens for criticism and help. Peer review fixed my mistake.

Thursday, July 14, 2011

Fallacy of composition, balanced budget version

Nicholas Johnson at the Center on Budget and Policy Priorities argues that the federal government, unlike states, shouldn't have to balance the budget:
From the economy’s perspective, the fact that states have to balance their budgets even in recessions makes it even more important not to require the federal government to do the same. States’ balanced budget requirements force them to cut spending and/or raise taxes at the worst possible time: when the economy is weak and needs more public and private spending, not less. These measures help keep state budgets in balance, but they can also make downturns longer and deeper — and the current downturn is no exception.
There's more to the story. States balance their budgets for a reason— if states attempt to use fiscal policy (government spending) to stimulate the economy, much of the stimulus leaks into bordering states. A New Hampshire stimulus package would end up stimulating Massachusetts, Maine, Vermont, and Canada. Because of these leaks, fiscal policy is less useful to New Hampshire policymakers. State government may perform better by forsaking weak attempts at fiscal policy and sticking to a balanced budget.

Fiscal policy at the federal level is much more effective because it covers a larger area, and there's less leaking as a proportion of the stimulus. It also solves the coordination problem between states (where New Hampshire policymakers don't account for the stimulus to Massachusetts, and Massachusetts policymakers ignore stimulatory effects on New Hampshire).

The macroeconomic policy lesson that we've learned over the last few years is that fiscal policy can matter a lot. Forsaking it at the federal level, where it works best, would be extremely foolish.

Sunday, July 10, 2011

Tax competition

CONCORD, N.H. - New Hampshire pays Michael Bergeron to be a full-time thief, sending him across the border in an unmarked black sedan to poach Massachusetts companies.

To help keep his missions undercover, the business recruiter even scraped the New Hampshire state seal off his Ford Fusion. Equal parts real estate agent, financial adviser, and deal fixer, Bergeron has lured dozens of Massachusetts companies to the Granite State over the past few years with promises of lower tax bills, cheaper office and industrial space, and fewer regulations.

John Hancock Financial and Liberty Mutual Group are among the high-profile firms that recently moved significant parts of their operations over the state line - partially because of Bergeron’s pitches. And an increasing number of small and midsize firms are considering migrating as a way to reduce costs in uncertain economic times. (Read more at the Boston Globe.)
HT: GraniteGrok.

Tuesday, July 5, 2011

Unfunded pension liabilities

Edward Glaeser argues that we should pay government workers to give up part of their pensions:
The problem with public pensions isn’t that teachers or firefighters or police officers are overcompensated. These are tough jobs. The problem is that public workers get too little of their pay while they work and too much when they retire. According to a new paper by Maria Fitzpatrick of Stanford University: “Schools and other public sector employers contribute nearly three times as much per hour worked to the pension benefits of their employees as their counterparts in the private sector.”

Many public workers would vastly prefer to get more money today in exchange for lower pension payments, Fitzpatrick finds in the study, “How Much Do Public School Teachers Value Their Retirement Benefits?

In 1998, Illinois upgraded the pensions that teachers would get on future earnings and gave these employees an opportunity to increase their pension payout based on past earnings. Teachers had the option of making a one-time payment equal to 1 percent of their salary per year of service prior to 1998, up to a maximum of 20 percent.

The returns of taking the deal were quite high, Fitzpatrick wrote. “The average price of the upgrade offered to employees with 25 years of experience in 1998 was $15,245 while the expected costs of providing them with the extra retirement benefits if they all purchased would have been $94,166.”

Yet even given those extremely generous terms, plenty of teachers preferred to have more money immediately: “More than 20 percent of these employees do not purchase more retirement benefits even when offered them at just 16 cents on the dollar.” Using a sophisticated statistical procedure, she determines that “averaging along the entire demand curve, employees in [Illinois Public Schools] are willing to trade just 30 cents for a dollar’s worth of future benefits.”

This work suggests that we should offer cash to public workers in exchange for giving up some of their future benefits. If public workers really only value their pensions at 30 cents on the dollar, then a deal where we paid workers 65 cents today to reduce the net present value of their benefits by a dollar, would essentially make both public workers and taxpayers 35 cents richer. [Emphasis added.]
The entire article is worth a read.

Saturday, July 2, 2011

Tim Geithner at Dartmouth

Courtesy of Andrew Samwick:


A few choice quotes:

"If you look at any history of financial crises, the speed with which growth went from negative to positive, the speed with which we've had stability come back to financial markets -- costs of credit coming down, equity prices, wealth, start to rise again -- was incredibly quick, relative to any experience we've had."

"If you look at the cost of this intervention we designed, even conservatively, today, it's going to be even less than one percent of GDP, less than one third the cost of the S&L crisis, an incredibly cost-effective, creative rescue of the financial system."

Friday, July 1, 2011

What if the federal minimum wage disappears?

Lucy Edwards, at Blue Hampshire, rhetorically asks,
Now that NH no longer sets its own minimum wage, what would happen if the federal minimum wage law were repealed? We've all been upset that we no longer can raise our wage above the federal limit, but imagine if the law were repealed? What do you think would happen to low wage workers? And maybe higher wage workers as well, as the race to the bottom accelerates?
I can't resist answering.

This is what David Neumark, a prominent minimum wage researcher and coauthor of Minimum Wages, has to say:
The central goal of raising the minimum wage is to raise incomes of low-income families and reduce poverty. There are three reasons why raising the minimum may not help to achieve this goal. First, a higher minimum wage may discourage employers from using the very low-wage, low-skill workers that minimum wages are intended to help. Second, a higher minimum wage may hurt poor and low-income families rather than help them, if the disemployment effects are concentrated among workers in low-income families. And third, a higher minimum wage may reduce training, schooling, and work experience—all of which are important sources of higher wages—and hence make it harder for workers to attain the higher-wage jobs that may be the best means to an acceptable level of family income.

The evidence from a large body of existing research suggests that minimum wage increases do more harm than good. Minimum wages reduce employment of young and less-skilled workers. Minimum wages deliver no net benefits to poor or low-income families, and if anything make them worse off, increasing poverty. Finally, there is some evidence that minimum wages have longer-run adverse effects, lowering the acquisition of skills and therefore lowering wages and earnings even beyond the age when individuals are most directly affected by a higher minimum....

Those interested in using economic policy levers to redistribute income to lower-income families should instead push for policy options that encourage work, that better target poor and low-income families, and that have a proven record of reducing poverty. The Earned Income Tax Credit, which is implemented at the federal level and supplemented by many states, appears to satisfy all of these criteria and thus is a better redistributive policy. (From Greg Mankiw.)
This is why nearly half of economists want the minimum wage abolished, a shockingly large percentage when you account for the fact that economists are far more likely to be registered Democrats than registered Republicans.

Thursday, June 30, 2011

Saturday, June 25, 2011

The impact of carbon taxes on New Hampshire manufacturing

Environmental economist Matthew Kahn estimates that a $15 per ton carbon tax would cause a 2.9% decline in New Hampshire manufacturing, or 1400 jobs.

The RGGI price is $1.89, suggesting a current, real-life decrease of approximately .4%, or 177 jobs.

Kahn adds:
Before opponents of cap and trade start to cite these numbers, it is important that clear headed folks keep in mind that this legislation will also stimulate the vaunted "green jobs" for the State. ...

The key point that nerds need to study is that such legislation simultaneously "destroys jobs" and "creates jobs". Here is another NBER study.

Sunday, June 19, 2011

Can New Hampshire afford to be last in economic growth?

In a recent Union Leader op-ed, Charlie Arlinghaus points out that New Hampshire, according to the latest BEA statistics, is last in economic growth in New England. Due to other data, he is "cautiously optimistic", but he argues that the low growth numbers should be interpreted as a warning sign by state policymakers.

Feeling warned, I took a closer look at the numbers. They do appear a little alarming, with New Hampshire in low-growth brown surrounded by states in high-growth blue (or at least middling white):


But what kind of warning is this?

Fortunately, the BEA provides detailed data on the contribution of different sectors to economic growth, so we can see exactly what's going on.

Browsing through their Excel file, it's clear that the housing sector is driving most of the difference. Here are the growth rates with housing excluded:

ME - 2.2%
CT - 2.9
NH - 2.9
RI - 2.9
VT - 3.0
MA - 3.6

To the extent that there is a warning, it's mostly about housing. Perhaps this is related to property taxes?

Of course, the difference could also be caused by factors unrelated to government policy, so we should interpret this data cautiously.

Tuesday, June 14, 2011

The fallacy of composition, union version

Earlier, I used an equation and some data from Richard Freeman and James Medoff's book What Do Unions Do? to estimate the deadweight losses created by New Hampshire unions.

But I committed a subtle fallacy of composition, which biases my estimate downward. (The fallacy of composition arises when someone assumes that the part -- in this case, New Hampshire -- works the same as the whole -- the United States. It doesn't.)

I also want to clarify what exactly deadweight losses are, because, in retrospect, it seems that my earlier essay could easily be misinterpreted.

This is a diagram of the unionized labor market:


The demand curve slopes downward because, as the wage decreases, employers want to buy more labor. The supply curve slopes upward because, as the wage increases, more people want to work in this sector.

In a perfectly competitive market, the wages offered and the amount of labor hired would be set at the intersection of the supply and demand curves. If the wage were higher, the available workers would outnumber the available jobs, and employers would find that they could lower wages and still get all the labor they need. If the wage were lower, the available jobs would outnumber the available workers, and employers would have to raise wages in order to attract more workers into the market. This feedback effect leads employers to offer the wage where the two lines intersect, where the quantity of labor demanded and the quantity of labor supplied are equal.

But if workers bargain as a union, instead of accepting the competitive market wage, they can set the price-- in effect, choosing any point they'd like on the demand curve. Higher wages, however, come at the expense of fewer jobs, since employers want fewer workers at the higher wage.

This creates the deadweight loss. Some workers would like to work at the competitive market wage but cannot, and the businesses that would be happy to hire them at that wage are unable to. The potential benefits from employment that go unrealized are deadweight losses, and these losses are represented by the red triangle. The area of this triangle is what I was trying to find.

To arrive at the earlier conclusion, I used data from the federal level to estimate the elasticity of demand (a measure of the shape of the demand curve), but this is not similar to the elasticity of demand in the New Hampshire market by itself. The New Hampshire market in isolation has a higher elasticity of demand (that is, a flatter demand curve, meaning employers are more sensitive to changes in wages), because employers have the option of crossing the border into a different state. To do the same thing on the U.S. level would require leaving the country entirely, which is more difficult.

If the earlier graph represents my earlier estimate, the revised estimate should look more like this:


This graph shows that the union wage differential leads some businesses move to different states, so that the demand for New Hampshire union labor is lower. This increases deadweight loss, first because there are more people who would like to work at the market wage, but can't. Second, when businesses leave the state to avoid the higher union wages, the businesses do better, but the costs of moving are pure deadweight losses, as opposed to the higher wages, which redistribute wealth from employer to employee (businesses shift from blue to smaller red losses).

The takeaway from all of this is that my earlier estimate, that the deadweight losses due to unions were .05% of New Hampshire GDP, is probably too low. Watch out for that fallacy of composition.

Thursday, May 26, 2011

Why are state legislators so crazy lately?

Betsy Russell at the Idahoan Spokesman-Review offers some informed speculation, drawing on a few high-profile political scientists.

HT: Seth Masket.

Wednesday, May 25, 2011

Apples, oranges, and right-to-work

Don Ewing at GraniteGrok argues that right-to-work laws decrease unemployment, increase personal income growth, and increase private sector employment.

But Don forgets that correlation does not imply causation.

In real life, states with right-to-work laws differ systematically from states without them, and this invalidates the comparisons.

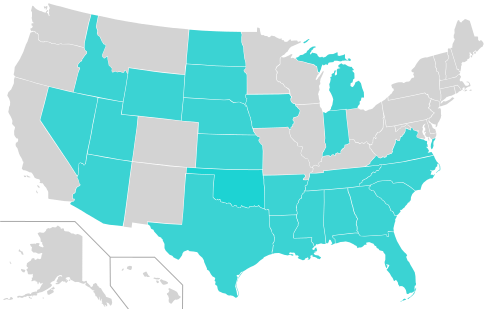
Wikipedia has a convenient map of right-to-work states (in blue):


Clearly these states are not randomly distributed across the map, leaving plenty of room for geographical factors to influence the numbers (notably unemployment rates).

The personal income measure used by the BEA— I think this is what Ewing was referencing— is the sum of all income earned, meaning that immigration patterns influence the growth rates. (A growing population leads to a higher total personal income.) And, according to research by Harvard economist Edward Glaeser, among others, one of the main determinants of immigration is the elasticity of the housing supply— that is, how easy it is to build new houses as the price of houses increases. For all we know, personal income growth in right-to-work states is being driven by the housing market. The same applies to growth in private sector employment.

Or the differences could be driven by one of a thousand other factors.

From what I've seen, using statistics to tease out the effects of particular state policies is ridiculously hard to do, and requires a much stronger statistical background than I have. This is a lot of the reason why I didn't even broach the subject in my union essay.

A quick search for an academic analysis of the issue found only this paper by Thomas Holmes. By comparing bordering counties in different states, he finds that a business-friendly regulatory climate increases the share of employment in manufacturing by about one third. But this study looks only at manufacturing, and only at counties on the borders of states (which means the estimate is inflated by an unknown amount). And the contribution of right-to-work laws to business-friendly regulatory climates is unknown.

So we can guess that right-to-work laws will increase the share of our employment in manufacturing by anywhere from zero to one-third. Which doesn't get us very far.

Monday, May 23, 2011

Our modest recession

Changes in unemployment from 2007 to 2010, by state:


According to Paul Krugman, New Hampshire fared well, at least in part, because it's a "cold [place] where nobody lives".

... Guess we can't have it all.

Wednesday, May 4, 2011

Why I wouldn't bet on a currency crisis

Denis Goddard on Capitol Access argues that the dollar is collapsing, and we're headed toward hyperinflation:


This comes after a variety of predictions of hyperinflation over the last few years, none of which have panned out. I don't think this one will, either.

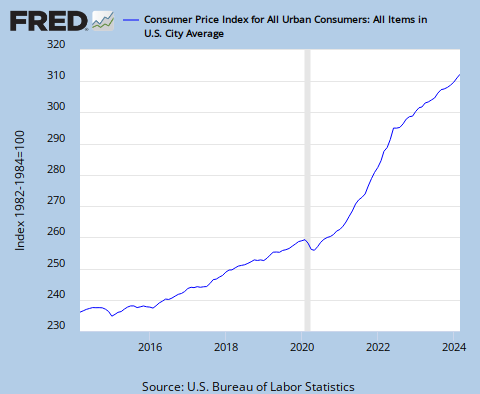
First, the data. Here is the Consumer Price Index, which measures inflation:


The trend over the last year or so should be taken with a grain of salt, because the CPI includes the prices of goods, such as gas and food, which vary greatly in response to changes in, for example, the weather or international politics. The core CPI, which excludes the more variable prices and is therefore a better measure of long-term inflationary trends, shows lower inflation than this graph. I'm showing the more inclusive, volatile CPI only because I don't want to be accused of underestimating inflation. (The Boston Fed has recently released research confirming that commodity prices do not predict long-term inflation.)

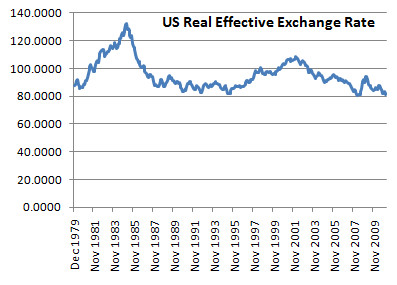
Here is the value of the dollar relative to other currencies:


Here is the interest payed on 10-year treasury bonds:


This suggests that the bond market expects inflation over the next 10 years to be a whopping 3.46%, or even less. [Edit: Unless real interest rates are negative, which is possible. However, we can use the interest payed on inflation-indexed bonds to estimate the real interest rate, and the latest figure is .86%. The difference between the two rates, the "spread", should approximately equal expected inflation. This suggests an expectation of 2.6% inflation over the next 10 years— shockingly low.]

None of these measures looks especially frightening. And the situation is unlikely to deteriorate, for multiple reasons.

First, the Fed is well prepared to fight inflation. If inflation starts rising significantly, it can sell some of its $2.7 trillion worth of assets for dollars, reducing the money supply. And thanks to the way fractional reserve banking works, when the Fed removes currency this way, the effect is multiplied, so that removing $2.7 trillion dollars shrinks the money supply by much more than $2.7 trillion. Taking money out of the economy also increases interest rates, which is what commentators usually refer to.

The Federal Reserve famously used this strategy in 1980 and '81 to eradicate the high inflation of the 1970s. In fact, it was so successful that the disinflationary pressures caused a recession. (Though preventing inflation is much easier than reducing it, so we needn't worry about another Fed-induced recession.)

The Fed can also raise reserve requirements for banks. This would lower the money multiplier, which would lower the money supply. And, as of 2008, the Fed can pay banks interest on their excess reserves— basically, pay them to not lend out money— which allows the Fed to more easily fine-tune inflation rates and the money supply.

Besides the Federal Reserve, another force will likely intervene to prevent a collapse of the U.S. dollar. If the dollar drastically depreciates (that is, loses value with respect to other currencies), the European Central Bank will probably expand the supply of Euros in an attempt to stabilize exchange rates. Why? Because, if the dollar depreciates, American goods become cheaper, and European goods become relatively more expensive, leading to higher American exports and lower European exports. This would harm the European economy. (In fact, the European Central Bank is already responding this way.) Other U.S. trading partners face the same incentives.

So probably no currency collapse any time soon.

(Hat tip to Dean Baker and Paul Krugman, and Paul Krugman again, for some data and arguments.)

Saturday, April 30, 2011

How to cut federal spending

Vote against HB126, which effectively nullifies the Affordable Care Act:

(Graph courtesy of the Kaiser Family Foundation, via Ezra Klein.)

According to this data, the American government spends more as a share of GDP on health than supposed bastions of government medicine, such as Canada or the U.K. (Ezra also helpfully notes that this does not include subsidies of employer-provided insurance, which are de facto government expenditures. Including this adds another percent of GDP to U.S. government health spending.*)

But I think this measure is too kind to the U.S. The more practical comparison is per capita spending:


The private/public spending proportions from the first graph, combined with the absolute spending levels of the second graph, allow us to calculate U.S. government health spending per capita. It's the second highest of the set, after Norway, at about $3500 per year. (Yes, this means we spend more per capita than France.) (If we include subsidies of employer-provided insurance, we almost match Norway— $4060 per year versus $4240 per year.)**

Of course, international comparisons generally find that we get poorer health outcomes for all of this spending.

If the American Care Act has an effect similar to the health care systems of these other countries, it seems likely that government spending will actually decrease. It's hard not to conclude that, contrary to Tea Party rhetoric, if the American Care Act is a government boondoggle, it's probably much less of a government boondoggle than the old system.

HB126 is currently retained in committee, meaning it'll be considered during the next legislative session.


* I took the estimate Ezra Klein cited from the Joint Committee on Taxation ($660 billion over 4 years) and divided it by 4. $165 billion is a bit more than one percent of U.S. GDP, which is approximately $14.2 trillion.

** The numbers come from multiplying the proportion of total health spending from the government (first graph) by the total spending (second graph). So, for example, for the U.S. estimate, 7.4/(8.5 + 7.4) × 7538 = 3508. To add employer subsidies, ((7.4 + 1.16)/(8.5 +7.4)) × 7538 = 4058.

Thursday, April 28, 2011

Who gets the gas tax cut?

Bill O'Brien's proposed gas tax holiday has at least one thing going for it-- the tax cut will actually be passed on to consumers.

Some commentators intuitively suspected that gas companies will receive the tax break (including myself, to be honest), probably drawing on the reaction to a very similar proposal from Hillary Clinton and John McCain during the last presidential primaries. (See Megan McArdle's discussion for background.)

But this intuition commits a fallacy of composition. The reaction of markets to a gas tax cut on the state level will not mirror the reaction to a cut on the federal level.

While it's true that the supply of gasoline is inelastic for the country as a whole, the supply of gas to New Hampshire in particular is very elastic, even in the short run. This is because gas can easily be shifted from one state to another. A quick search for empirical evidence bears this out.

So consumers get the tax cut.

Monday, April 25, 2011

Should libertarians support unions?

As a result of pending anti-union legislation, I have been researching union issues for the last few weeks, especially with respect to libertarian philosophy. Historically, libertarians, in a political coalition with business interests on the right, have opposed unions, but is there room to ally with liberals here?

In order to answer this question, we need to understand the proposed changes.

The first is hidden at the very bottom of the intimidating, hundreds-of-pages-long HB2, which addresses all sorts of vaguely budget-related issues. (It took me something like 20 minutes to find the actual text of the amendment. So when critics complain that the legislating process in this case has not been very open or democratic, they have a good point.)
462 New Paragraph; Impasse in Collective Bargaining. Amend RSA 273-A:12 by inserting after paragraph VII the following new paragraph:

VIII. For any collective bargaining agreement entered into by the parties after the effective date of this paragraph, if the impasse is not resolved at the time of the expiration of the parties’ agreement, the terms of the collective bargaining agreement shall cease and all employees subject to the agreement shall become at-will employees whose salaries, benefits, and terms and conditions of employment shall be at the discretion of the employer.
This reverses paragraph VII of RSA 273-A:12 Resolution of Disputes, which applies to public employee labor relations:
VII. For collective bargaining agreements entered into after the effective date of this section, if the impasse is not resolved at the time of the expiration of the parties' agreement, the terms of the collective bargaining agreement shall continue in force and effect, including but not limited to the continuation of any pay plan included in the agreement, until a new agreement shall be executed. Provided, however, that for the purposes of this paragraph, the terms shall not include cost of living increases and nothing in this paragraph shall require payments of cost of living increases during the time period between contracts.
It is not clear that this has any relation to libertarian philosophy.

Currently, if contract negotiations fail, the government automatically extends the old, expiring contract. Basically, all government labor contracts have an implicit evergreen clause. If this amendment becomes law, failed negotiations will revert, instead, to a situation where government employees can be fired at the whim of their employer. (Though, as Diana Lacey explains, the change will not apply to current contracts, giving unions a perverse incentive to ride out their current contracts until someone alters the law to allow evergreen clauses again.)

So no one is having their freedom restricted or extended. The government is simply altering the way it does business.

From a more practical perspective, this would take away bargaining power from public-sector unions. Do we want that? Not necessarily. Chesterfield Democrat Tully Fitzsimmons points out that the government, besides being a coercive monopoly, is also, in many cases, a monopsony-- that is, the only buyer in a market. And unlike private employers, the government does not have to follow its own labor contracts. Legislators can alter the contracts as they wish. Union bargaining power may be required to balance these unfair advantages.

(Interestingly, economic theory suggests that a market with both a monopoly and a monopsony, known as a bilateral monopoly, can be more economically efficient -- less wasteful -- than a market with a monopoly alone, or only a monopsony. It is not clear, though, that this is happening between public-sector unions and government employers, given the current state of government workers. What is clear is that union bargaining power redistributes wealth from the government to government employees. Beast-starvers, take note.)

Another argument from those opposed to public-sector unions is that the unions lobby for more government. And this is true. But, as Grant Bosse has explained, contrary to some claims from the left, this will hardly end public-sector unions. So it's a moot point.

The second piece of legislation is HB474, the right-to-work bill.

The bill is sold as an expansion of individual liberties. However, the fine print reveals that it "prohibits collective bargaining agreements that require employees to join a labor union." In other words, this is a "positive" liberty, which requires the government to intervene in private affairs in order to provide it-- closer to the right to health care than the right to free speech. In 2004 the platform of the Libertarian Party opposed right-to-work laws for this reason.

I've heard three main arguments anti-union libertarians use to excuse their interference with consensual agreements in this case.

One is economic-- unions, they say, are cartels of labor. They drive up prices, restrict employment, and redistribute wealth from poorer workers (who are now unemployed) to more established workers.

To help evaluate these arguments, I turned to What Do Unions Do?, a book by Richard Freeman and James Medoff, both pro-union labor economists. (A group of more conservative-minded economists recently devoted another book to reviewing this one, and found that it was generally correct.)

It turns out that the redistributive effects are progressive (for those who care about that sort of thing). And union-induced inflation is small.

Freeman and Madoff agree that unions are basically cartels of labor, but they argue that the harmful aspects of labor unions are subject to considerable economic restraints. In a competitive market, if a union raises wages, it will simply put its employer out of business. Knowing this, the union focuses less on using its monopoly power to raise wages and more on economically benign improvements to workers' experience in the workplace. In less competitive markets, unions are sometimes able to gain more influence. (Other times large employers will use their market power to undermine union efforts.) Occasionally unions are able to organize the entire workforce of a competitive market, and coordinate wage demands between them, but this is rarer.

According to Freeman and Madoff, the economic loss resulting from union efforts in 1980 was about 0.3% of U.S. GDP. In New Hampshire today, unionization levels are lower (The Center for American Progress says 12.4%), and the union vs. non-union wage gap is lower. Using the same methodology, I estimate that the current economic losses in New Hampshire due to unions are approximately 0.05% of NH GDP, which is the equivalent of about $22 per person per year ($28.5 million).*

Of course, even with right-to-work laws, unions will still be around. The Sentinel has argued that the proposed law would have relatively minor effects. If we err on the side of a larger effect, halving the economic costs of unionization, that still only creates the equivalent of $11 per person, or $14 million. (My math has been a little crude, but this should be a decent ballpark estimate of the effect of the bill.)

To put this in a different perspective, libertarians were willing to pay $2.85 per person ($3.7 million) in lost federal money in order to forgo seat belt laws. (And arguably much more.) How much are collective bargaining rights worth in comparison?

(The Center for American Progress' paper also notes that a decline in unionization would hurt the economy by lowering the income of some workers. This is true, in the short run, if you accept modern Keynesian macroeonomics. But the sword cuts both ways-- if the economic losses from union monopoly power are small, then the short-run gains are also small.)

A second argument in favor of right-to-work is that the government already intervenes on labor's side in a variety of ways, so it's only fair that it intervene in favor of business, to correct the imbalance.

A quick perusal of my handy labor economics textbook shows that the empirical side of this argument is true. Employer rights are abridged by the Norris–La Guardia Act and the Wagner Act. (Though the Taft–Hartley Act later added some restrictions to unions.) However, I don't find this argument persuasive. The important question is, do we prefer the situation under the current law, or would we prefer the outcomes produced by a right-to-work law? What does it matter that the government has already changed some things?

The last argument is political. Unions lobby for bigger government, and a right-to-work law would presumably undermine their lobbying strength.

On the federal level, Freeman and Madoff find this to be true, to a degree. Unions generally do not succeed in promoting specifically pro-union legislation, due to strong business resistance, but they do help pass (allegedly) pro-worker legislation, such as minimum wage increases and workplace safety laws. And even under a right-to-work system, unions will still be around, and they'll still lobby the government (only less intensely). Based on the information available, it is probably impossible to predict if a right-to-work law would be one step back for two steps forward, or two steps back for one step forward.

So what's the takeaway for libertarians?

Much as I'd like to, I can't make an airtight case for the libertarian support of unions. At the same time, the anti-union case itself leaves much to be desired.

Are union issues full of potential for liberal-libertarian cooperation? I don't know. There's plenty of room for libertarians on both sides of the debate.


* Mathematical note:

To arrive at their estimate, Freeman and Madoff use the equation

½ × (union wage effect)/100 × (decline in employment in union sector due to wage effect)/100 × (fraction of labor force in unions) × (the fraction of total costs associated with labor) = (deadweight loss)

"This formula estimates the size of the triangle under the demand curve for union labor, which provides an estimate of what the social loss would be if all output were produced under collective bargaining, and then multiplies this amount by an estimate of the fraction of all output produced in unionized settings." (Freeman and Madoff, What Do Unions Do?, 1984, p. 267)

The equation is taken from Arnold Harberger, 1971, "Three Theorems of Applied Welfare Economics".

David Madland and Karla Walter, at the Center For American Progress, cite the union wage effect in New Hampshire as 7% (p. 2 of the .pdf). However, as far as I can make out, this estimate does not include fringe benefits, which implies that it is biased downward. It also does not account for the positive effects that union wages have on the wages of non-union workers, which would further bias the estimate downward. Finally, they note that, for other, more technical reasons, they expect their estimate to be biased downward (see note 2 on p. 4 of the .pdf). Rather than try to correct for this somehow, I decided to substitute it with federal-level data. I found this in a Cornell study, which in turn took the data from Barry Hirsch and David MacPherson's Union Membership and Earnings Data Book (p. 12 of the .pdf). They estimate an effect of 14%.

I was also unable to find data on the unemployment induced by higher union wages. To estimate it, I assumed that the amount of unemployment is proportional to the increase in wages. Freeman and Madoff's data suggest that the percentage of union-induced unemployment is about 2/3 of the percent wage increase (that is, a price-elasticity of demand of -.66). Therefore, a 14% wage increase implies a 9.3% decline in employment (14 × 2/3 = 9.3). I do this because I'm guessing that the elasticity of labor demand for union employers in the past will be a decent guide to current labor demand elasticities, because union members will still be employed largely by the same types of employers. This is a slightly dubious approach, as relevant conditions might have changed since their 1980 estimate. Fortunately, according to my labor economics textbook (Filer, Hamermesh, and Rees, 1996) the long-term price-elasticity of demand is about -1 for the entire labor market, with skilled workers generally having a lower elasticity (that is, greater than -1) and unskilled workers generally having a higher elasticity (less than -1) (p. 167-168). Since skilled workers are disproportionately represented in labor unions, this lends plausibility to my estimate. (Because I am assuming that higher wages cause declines in employment, this estimate does not account for possible employment gains in situations of bilateral monopoly, and this is a source of a possible upward bias.)

The unionization rate is taken from the Center for American Progress paper (p. 2 of the .pdf).

I found the "fraction of total costs associated with labor" (that is, labor's share of output) using data from the U.S. Bureau of Economic Analysis, which can be found via the NH Economic and Labor Market Information Bureau.

$58.036 billion (total state income) / $35.343 billion (wages, salaries, and benefits) = .609 (labor's share of output)

The final equation is thus:

½ × .14 × .093 × .124 × .61 = 0.00049

Naturally, since I have substituted a federal-level wage gap estimate for what should be a state-level measurement, and because I had to make an educated guess about union-induced unemployment, this number will not be exactly correct. It should be perfectly adequate, however, for its uses in this article.

These numbers imply deadweight losses of about $28.5 million:

$58.036 billion × 0.00049 = $28.5 million

About 1.3 million people live in New Hampshire, implying about $22 of deadweight loss per person:

$28.5 million / 1.3 million people = $22 per person


[This is a slightly polished version of an essay originally posted on Free Keene.]